Run an outage statistic report for a period of time.
Step-by-step guide
From the main PYXIS window click on the Reporting menu > Statistics
- PYXIS > Reporting > Statistics
- Select the Start and End Dates for the reporting Time Span you want to run

- If you want to run a summary based on a specific Equipment Code, check the box and select the equipment from the dropdown:
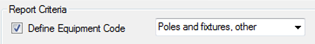
- Otherwise do NOT check the box if you want the summary to include all Equipment
- Click the Get Data button
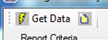
- This will populate the data for the report based on your selections
- If you remove the checkbox next to any of the Cause Codes, the statistics data in the grid at the bottom will automatically update accordingly
- To produce a report with a chart, now click the Show Report button
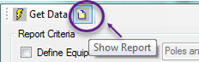
- This opens the Report Viewer displaying a chart and a table of the outage summary statistic data